Weekly NASDAQ Update: +27% Annual Returns Since 1999 – Here’s What the Model Says Now
Our Tactical NASDAQ Model turned $10K into over $5 million with 27% annual returns since 1999 — crushing the NASDAQ. This week’s update reveals the model’s current position, market signals, and more.
📅 Date: 26.04.2025
Last week, the NASDAQ-100 roared back to life, jumping roughly 9.1% from a Monday open at 17,808 to close on Friday at 19,433—narrowing its year-to-date loss to about 6%. The surge was led by semiconductor and AI stocks, with Nvidia rallying around 12% on the heels of stronger-than-expected AI cloud revenues. Mega-cap tech also impressed, as Microsoft, Alphabet and Meta all topped earnings and revenue forecasts. Early worries over new U.S. export restrictions on GPUs gave way to relief when reports suggested further curbs might be delayed, easing trade-tension jitters. Technically, the widening gap between the 50- and 200-day moving averages confirmed the bullish momentum, while the VIX fell from the low-20s to the high-teens, signaling calmer markets. As we head into this week, the upcoming U.S. PPI release, fresh Fed commentary and key earnings from Apple and Amazon will be critical—stay tuned to Inside the Model for how our tactical signals are positioned amid this renewed strength.
🆓 Public Section – Backtest & Model Performance 📊
How The Nasdaq Tactical Model Has Performed Over Time
Every week, I share an updated look at how my Nasdaq Tactical Strategy has performed in historical backtests. This ensures full transparency and allows you to compare the strategy's results against traditional Buy & Hold investing.
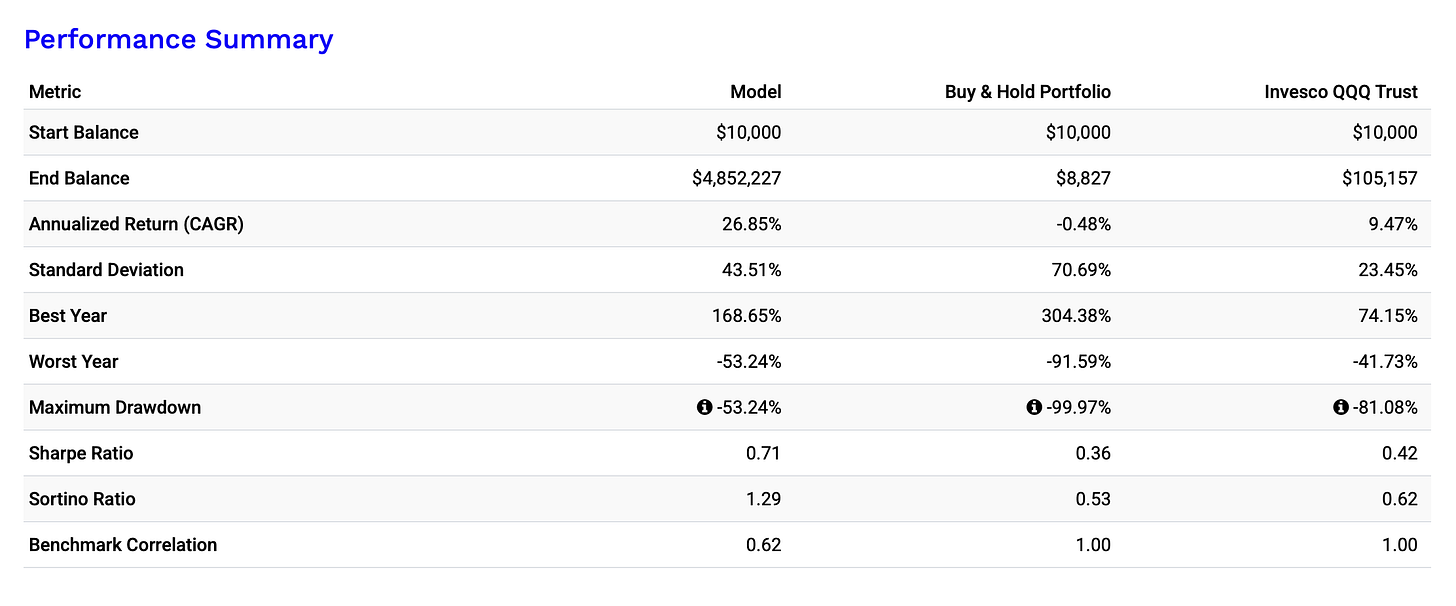
📊 Backtest Results (1999-2025):
💡 Why This Works
Unlike traditional investing, this model avoids catastrophic losses by dynamically shifting between 3x leveraged Nasdaq ETFs (TQQQ/3QQQ) and cash (T-Bills) when the trend weakens. I chose the worst start time in NASDAQ history, just before the dotcom bubble burst. However, the performance is tremendous.
✅ Survived the Dotcom Bubble (-29% vs. -99%)
✅ Handled 2008 better than Buy & Hold (-34% vs. -93%)
✅ Managed 2022 tech sell-off with controlled losses (-46%)
Here you can see the incredible performance:
and the annualized outperformance for the last 25 Years compared to the QQQ:
📢 Every week, I share fresh backtesting insights to ensure that this strategy remains one of the most robust in the market.
🚀 Exclusive Content – Only for Premium Subscribers
👉 Upgrade to Premium to unlock my latest market insights, portfolio breakdowns, and trade signals!
🔒 This Week’s Premium Section Includes:
✅ 📊 My Current Portfolio & Allocation – What I’m holding & why
✅ 📉 Market Trends & My Technical Analysis – Where the Nasdaq is heading
✅ 🔍 Next Trade Signals – Key price levels that will trigger action
🔒 Premium Section
Portfolio Breakdown & Market Outlook
Keep reading with a 7-day free trial
Subscribe to The Nasdaq Playbook to keep reading this post and get 7 days of free access to the full post archives.


