


Weekly NASDAQ Update: +27% Annual Returns Since 1999 – Here’s What the Model Says Now
Our Tactical NASDAQ Model turned $10K into over $5 million with 27% annual returns since 1999 — crushing the NASDAQ. This week’s update reveals the model’s current position, market signals, and more.

📅 Date: 28.06.2025
🧠 Model Update: Two New Systems Now Live
This week marks a major evolution in the Nasdaq Playbook framework:
Both the RSI + MACD Trend Filter and the Heikin-Ashi Crash Detection Module are now fully integrated into the model — with live execution going forward.
These systems were built to complement the Core Momentum Engine:
The RSI + MACD Add-On specializes in spotting early trend shifts and avoiding false breakouts during volatile, indecisive periods.
The Heikin-Ashi Module acts as a crash radar — cutting losses early and re-entering fast when panic subsides.
Together, they fill the gaps left by traditional trend-following strategies and expand our toolkit across all market regimes.
✅ From now on, any fresh trades triggered by these models will be executed in real time — and fully disclosed to Paid Subscribers.
📈 Market Recap: Nasdaq 100 Weekly Snapshot
The Nasdaq 100 gained +1.4% last week, pushing further into all-time high territory.
Mega caps continued to lead, with Apple, Amazon, and Microsoft extending their breakout runs, while NVIDIA consolidated after its historic surge.
Breadth remains supportive, volatility (VXN) is near cycle lows, and momentum is firmly positive — but overbought conditions are starting to build.
The market feels calm, but beneath the surface, positioning is stretched.
The upcoming inflation and labor market data may be the catalysts that decide whether this calm continues — or cracks.
📊 Still Think This Is Just Hype?
You’re thinking this sounds too good to be true? That it’s just another flashy system built on backfitting and big talk?
Perfect. We built it for skeptics.
Check the full independent backtest — from 1999 to today.
Same 27%+ CAGR. Lower drawdowns. Better consistency. Across every market regime.
👉 Download it. Stress it. Break it. Then decide.
We’ll be here — still systematic.
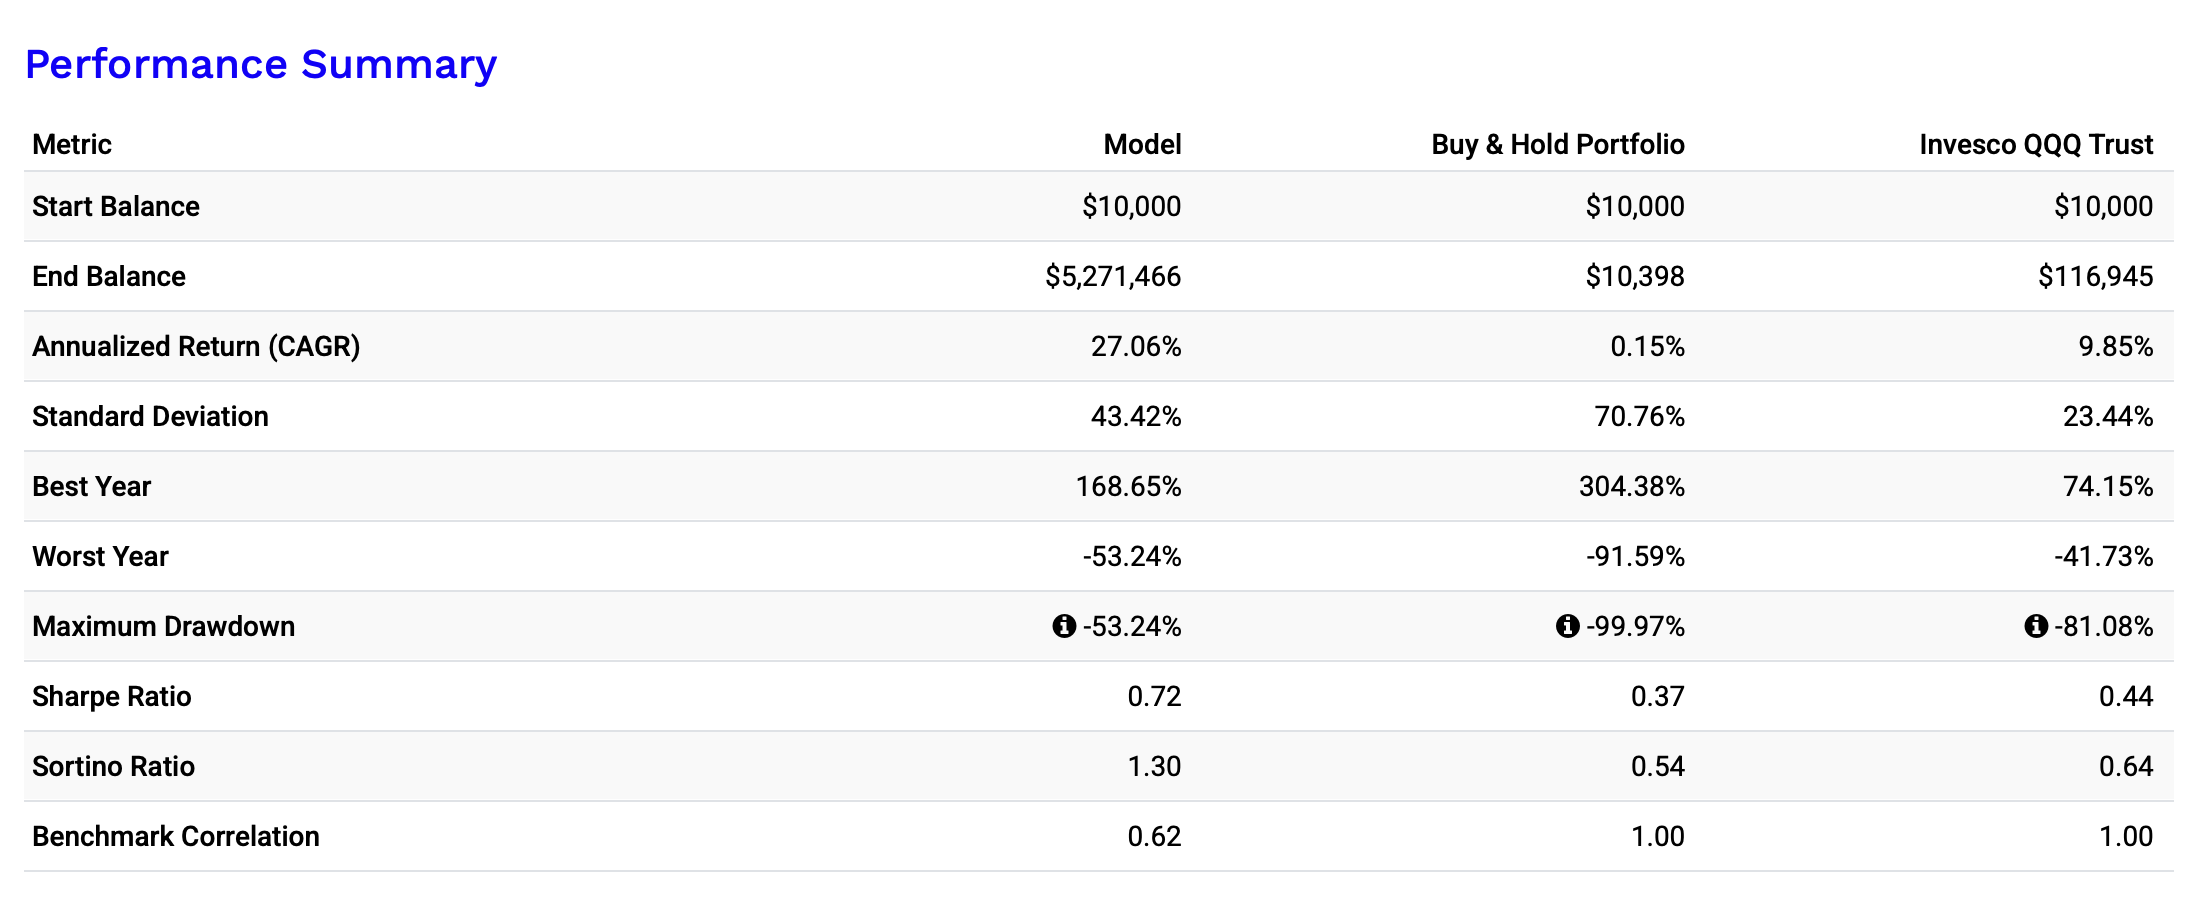
📊 Backtest Results (1999-2025):
💡 Why This Works
Unlike traditional investing, this model avoids catastrophic losses by dynamically shifting between 3x leveraged Nasdaq ETFs (TQQQ/3QQQ) and cash (T-Bills) when the trend weakens. I chose the worst start time in NASDAQ history, just before the dotcom bubble burst. However, the performance is tremendous.
✅ Survived the Dotcom Bubble (-29% vs. -99%)
✅ Handled 2008 better than Buy & Hold (-34% vs. -93%)
✅ Managed 2022 tech sell-off with controlled losses (-46%)
Here you can see the incredible performance:

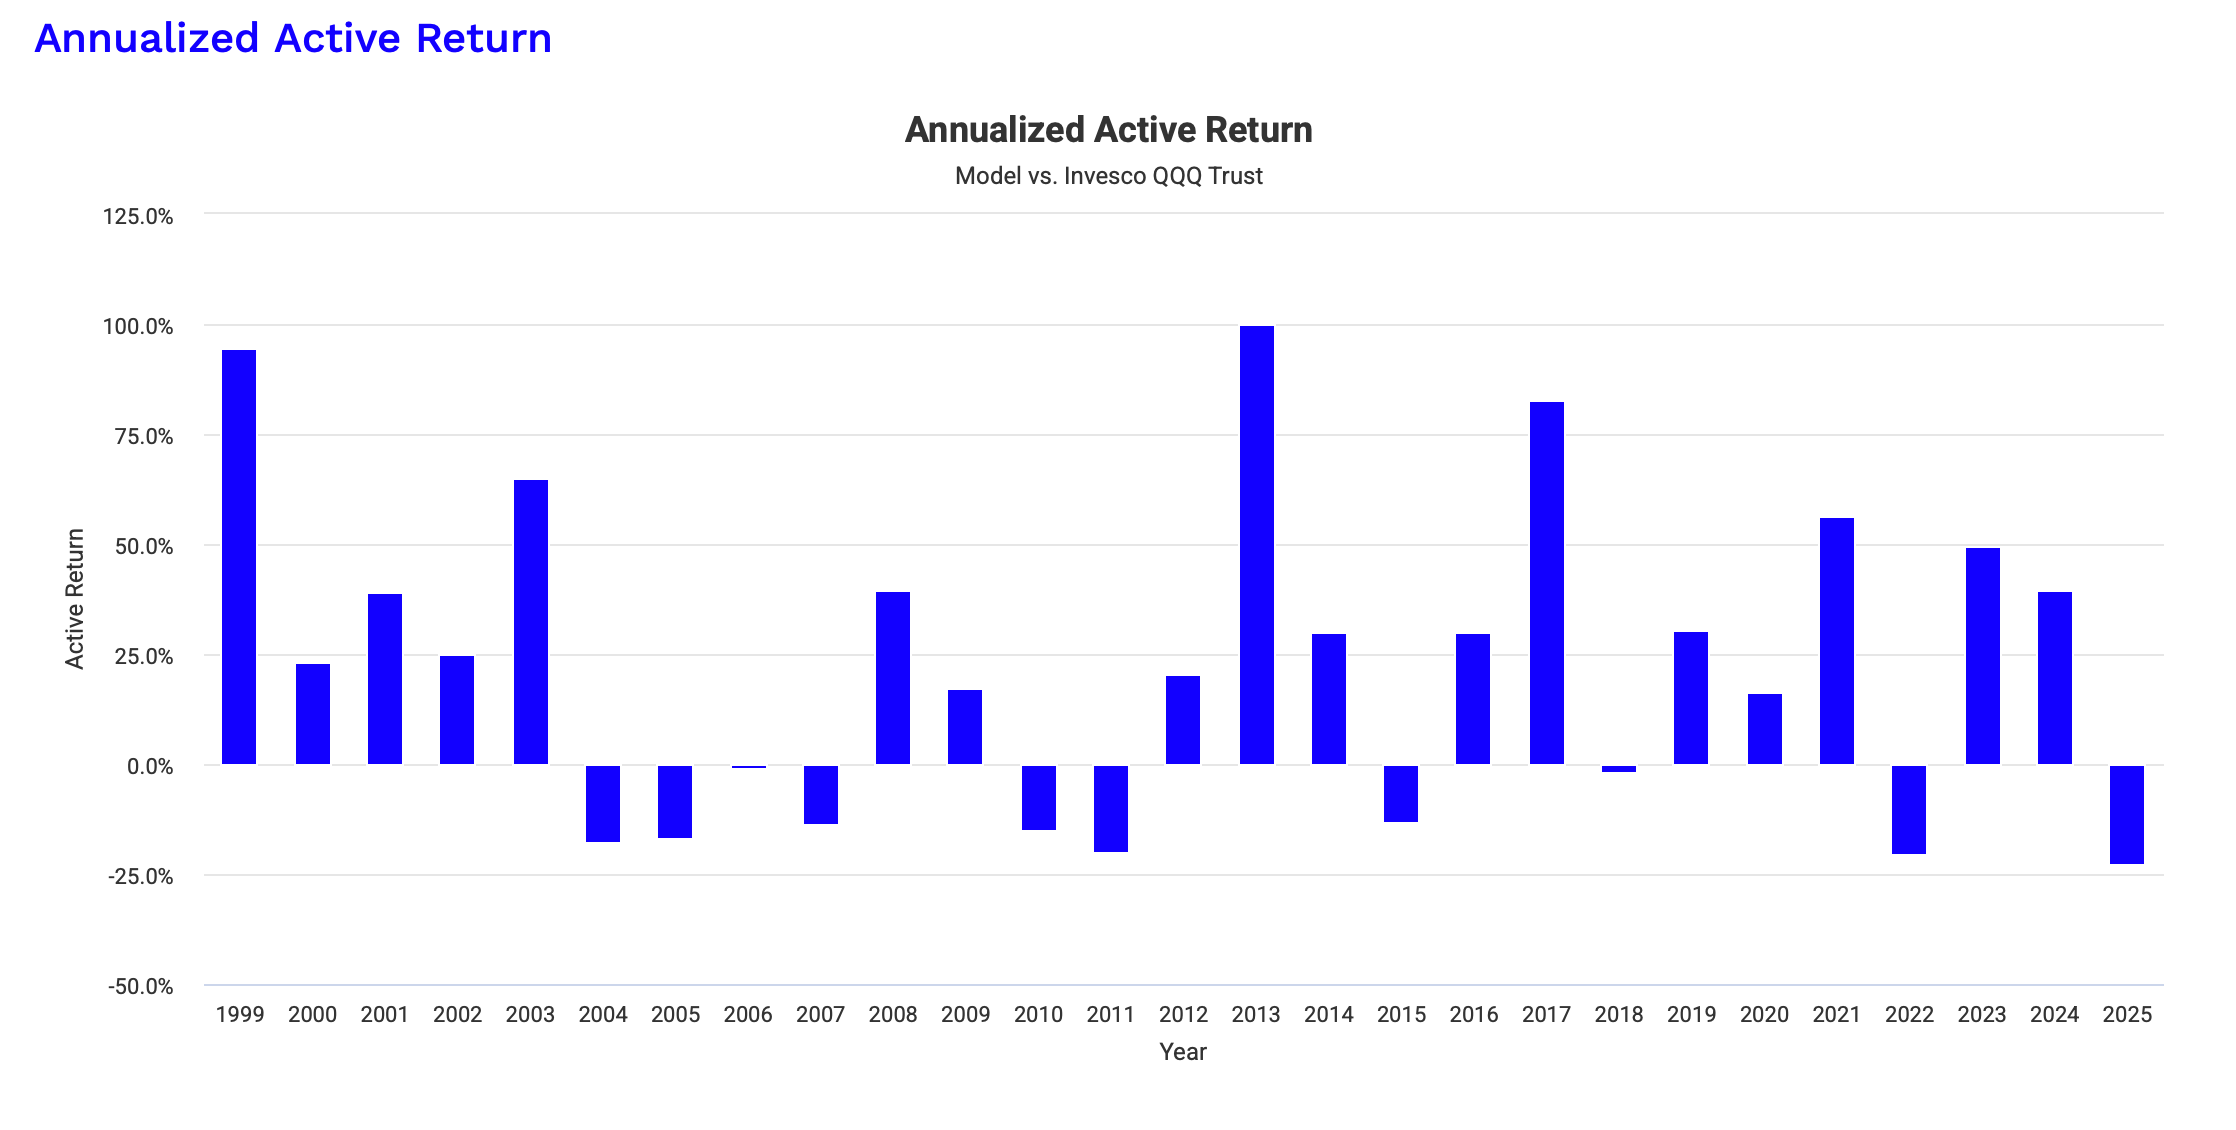
and the annualized outperformance for the last 25 Years compared to the QQQ:
🔒 Want the Signals? Join the Inner Circle.
What you’ve just read is the theory.
The execution — the real-time signals, portfolio updates, and system-specific breakdowns — that’s reserved for Paid Subscribers.
🔒 This Week’s Premium Section Includes:
✅ 📊 My Current Portfolio & Allocation – What I’m holding & why
✅ 📉 Market Trends & My Technical Analysis – Where the Nasdaq is heading
✅ 🔍 Next Trade Signals – Key price levels that will trigger action
🔒 Premium Section
Portfolio Breakdown & Market Outlook
Keep reading with a 7-day free trial
Subscribe to The Nasdaq Playbook to keep reading this post and get 7 days of free access to the full post archives.