


Weekly NASDAQ Update: +27% Annual Returns Since 1999 – Here’s What the Model Says Now
Our Tactical NASDAQ Model turned $10K into over $5 million with 27% annual returns since 1999 — crushing the NASDAQ. This week’s update reveals the model’s current position, market signals, and more.

📅 Date: 17.05.2025
Last week, the NASDAQ 100 continued its impressive rebound after a period of consolidation, posting strong gains and reclaiming key technical levels.
Weekly Performance: The index gained approximately +3.2%, powered by strength in large-cap tech and semiconductor names.
Market Drivers: The move was supported by better-than-expected inflation data and a dovish tone in the latest Fed minutes, which increased market confidence in a potential rate pause this summer.
Technical Outlook:
The index successfully closed back above the 200-day moving average (currently near 4910).
It also broke through short-term resistance in the 4880–4890 range.
The RSI pushed past 59, indicating continued bullish momentum.
Looking Ahead:
The NASDAQ 100 now sits in a bullish technical setup. If the breakout holds, a move toward the previous highs could be in play. However, the 5000–5030 zone remains a major resistance area to watch.
🆓 Public Section – Backtest & Model Performance 📊
How The Nasdaq Tactical Model Has Performed Over Time
Every week, I share an updated look at how my Nasdaq Tactical Strategy has performed in historical backtests. This ensures full transparency and allows you to compare the strategy's results against traditional Buy & Hold investing.
📊 Backtest Results (1999-2025):
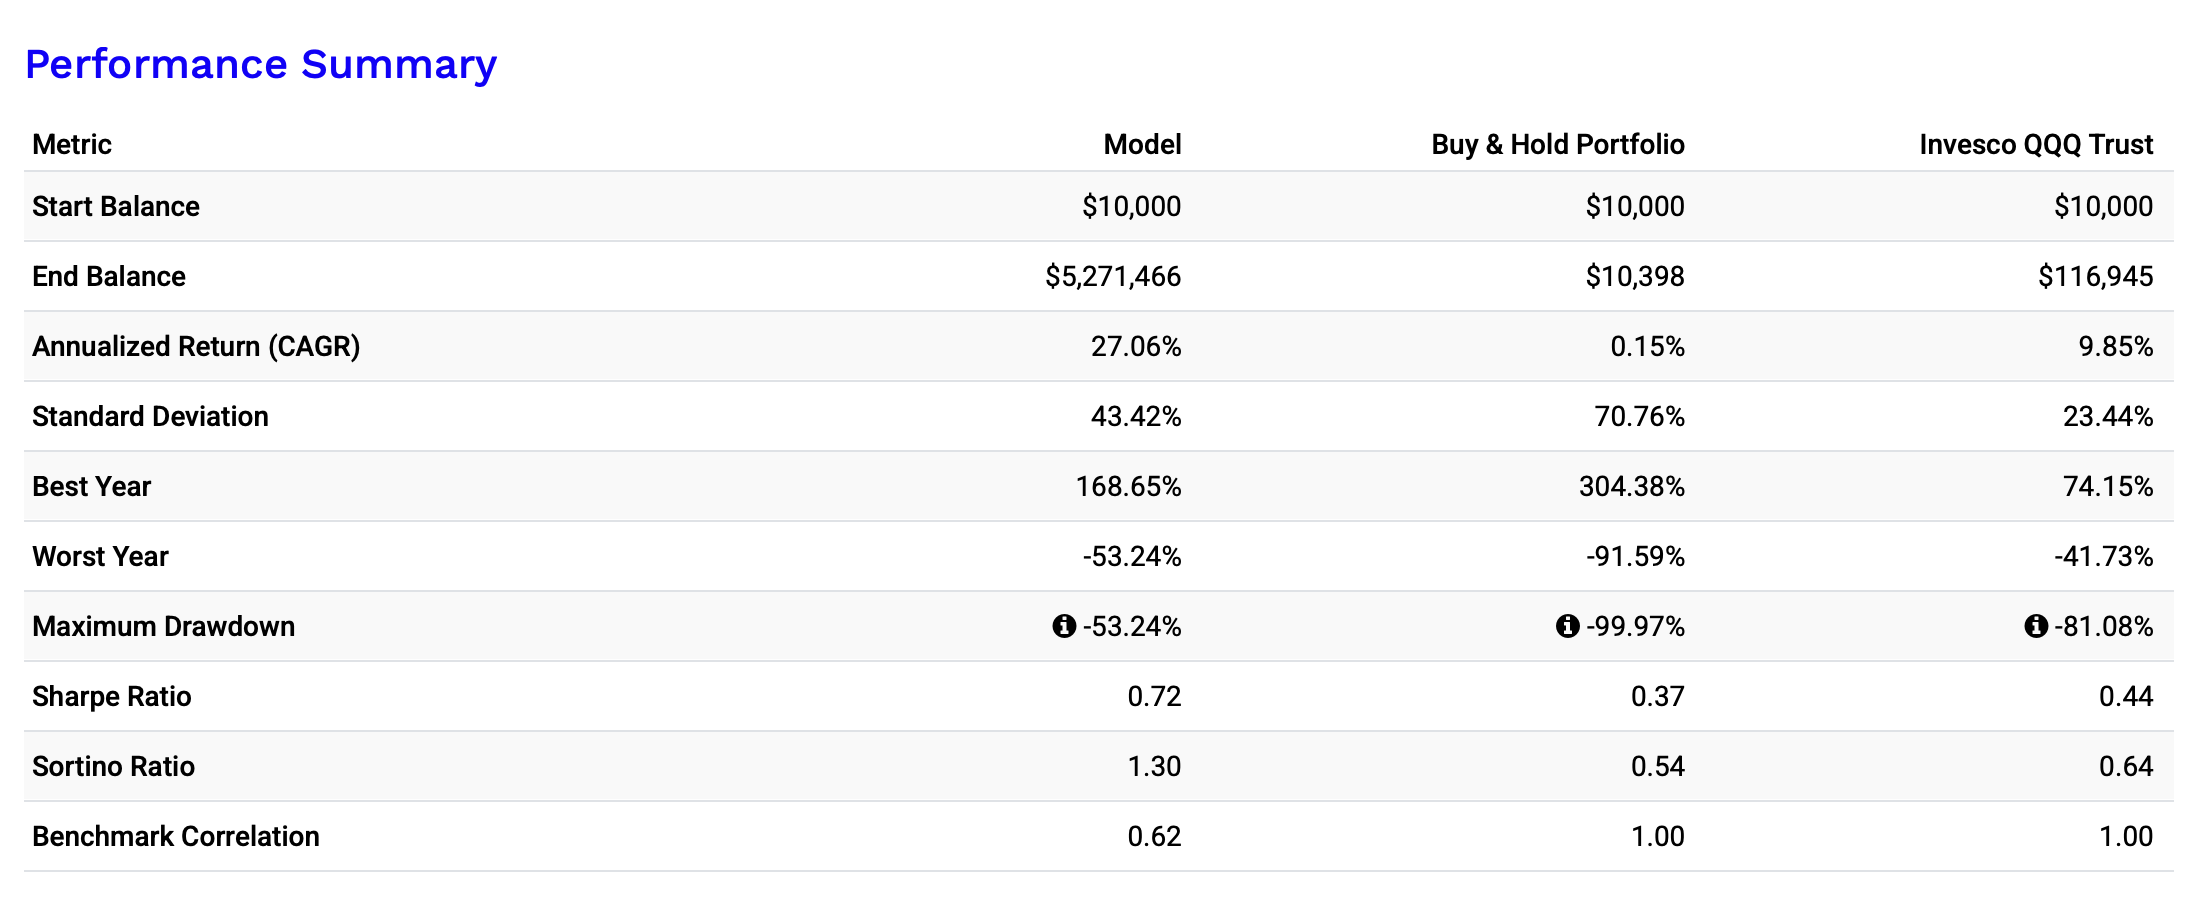
💡 Why This Works
Unlike traditional investing, this model avoids catastrophic losses by dynamically shifting between 3x leveraged Nasdaq ETFs (TQQQ/3QQQ) and cash (T-Bills) when the trend weakens. I chose the worst start time in NASDAQ history, just before the dotcom bubble burst. However, the performance is tremendous.
✅ Survived the Dotcom Bubble (-29% vs. -99%)
✅ Handled 2008 better than Buy & Hold (-34% vs. -93%)
✅ Managed 2022 tech sell-off with controlled losses (-46%)
Here you can see the incredible performance:

and the annualized outperformance for the last 25 Years compared to the QQQ:
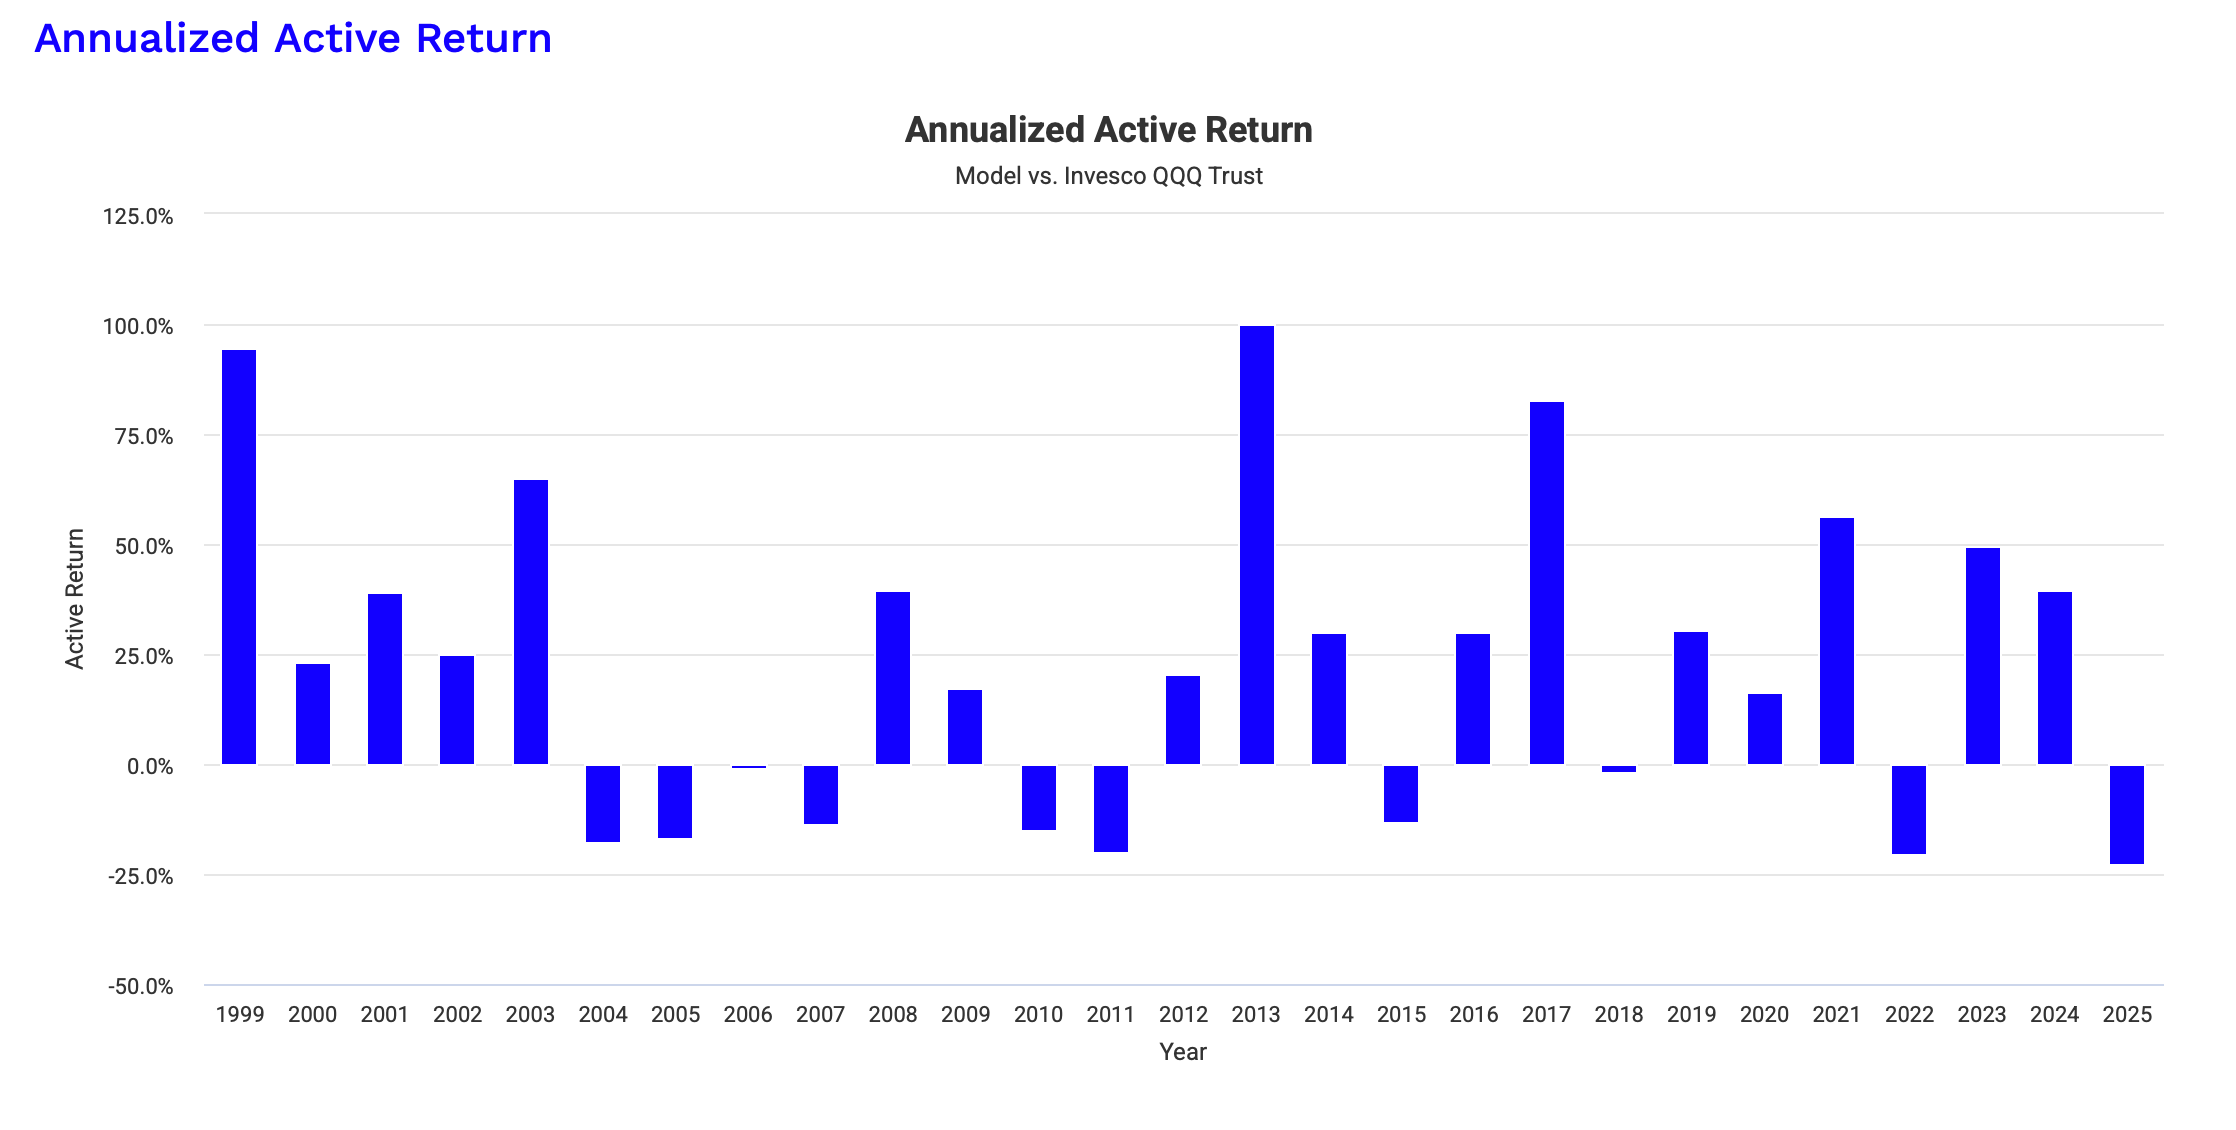
📢 Every week, I share fresh backtesting insights to ensure that this strategy remains one of the most robust in the market.
🚀 Exclusive Content – Only for Premium Subscribers
👉 Upgrade to Premium to unlock my latest market insights, portfolio breakdowns, and trade signals!
🔒 This Week’s Premium Section Includes:
✅ 📊 My Current Portfolio & Allocation – What I’m holding & why
✅ 📉 Market Trends & My Technical Analysis – Where the Nasdaq is heading
✅ 🔍 Next Trade Signals – Key price levels that will trigger action
🔒 Premium Section
Portfolio Breakdown & Market Outlook
Keep reading with a 7-day free trial
Subscribe to The Nasdaq Playbook to keep reading this post and get 7 days of free access to the full post archives.