


Weekly NASDAQ Update: +27% Annual Returns Since 1999 – Here’s What the Model Says Now
Our Tactical NASDAQ Model turned $10K into over $5 million with 27% annual returns since 1999 — crushing the NASDAQ. This week’s update reveals the model’s current position, market signals, and more.

📅 Date: 07.06.2025
📈 Nasdaq-100 Weekly Summary (June 2–6, 2025)
The Nasdaq-100 Index posted a strong performance this week, gaining approximately 2% and closing at 21,761.79 on Friday, June 6. The index showed resilience despite mixed macroeconomic signals and ongoing political tensions.
🗓 Daily Performance Recap:
Monday, June 2: +0.71% — Momentum carried over from the previous week, driven by optimism around AI and tech earnings.
Tuesday, June 3: +0.79% — Continued rally as VXN (Nasdaq Volatility Index) began to moderate.
Wednesday, June 4: +0.27% — A quieter session with buyers cautious ahead of the jobs report.
Thursday, June 5: -0.80% — Markets pulled back on hawkish Fed commentary and political noise.
Friday, June 6: +0.99% — Strong rebound following the May jobs report and a Tesla-led rally.
🔍 Key Drivers
Labor Market: The U.S. economy added 139,000 jobs in May, slightly above expectations but well below the 12-month average. Wage growth came in at 3.9% YoY, raising fresh concerns over inflation and delaying hopes for rate cuts.
Volatility: VXN closed the week at 21.48, still above the model’s comfort zone. While trending down, it remains elevated relative to typical trend-following regimes.
Corporate Headlines:
Tesla rebounded 3.7% on Friday after Thursday’s 14% selloff triggered by a public feud between CEO Elon Musk and President Trump.
Palantir jumped 6.5% after announcing a new government analytics deal.
Nvidia rose 1.2% on Friday as bullish sentiment around AI remained intact.
🧠 Summary
The market showed notable strength but remains under the influence of macro uncertainty. Traders are watching closely to see if this week's rally has enough follow-through to sustain a breakout — or if it’s another failed bounce in disguise.
Stay tuned for further model updates in The Nasdaq Playbook.
🆓 Public Section – Backtest & Model Performance 📊
How The Nasdaq Tactical Model Has Performed Over Time
Every week, I share an updated look at how my Nasdaq Tactical Strategy has performed in historical backtests. This ensures full transparency and allows you to compare the strategy's results against traditional Buy & Hold investing.
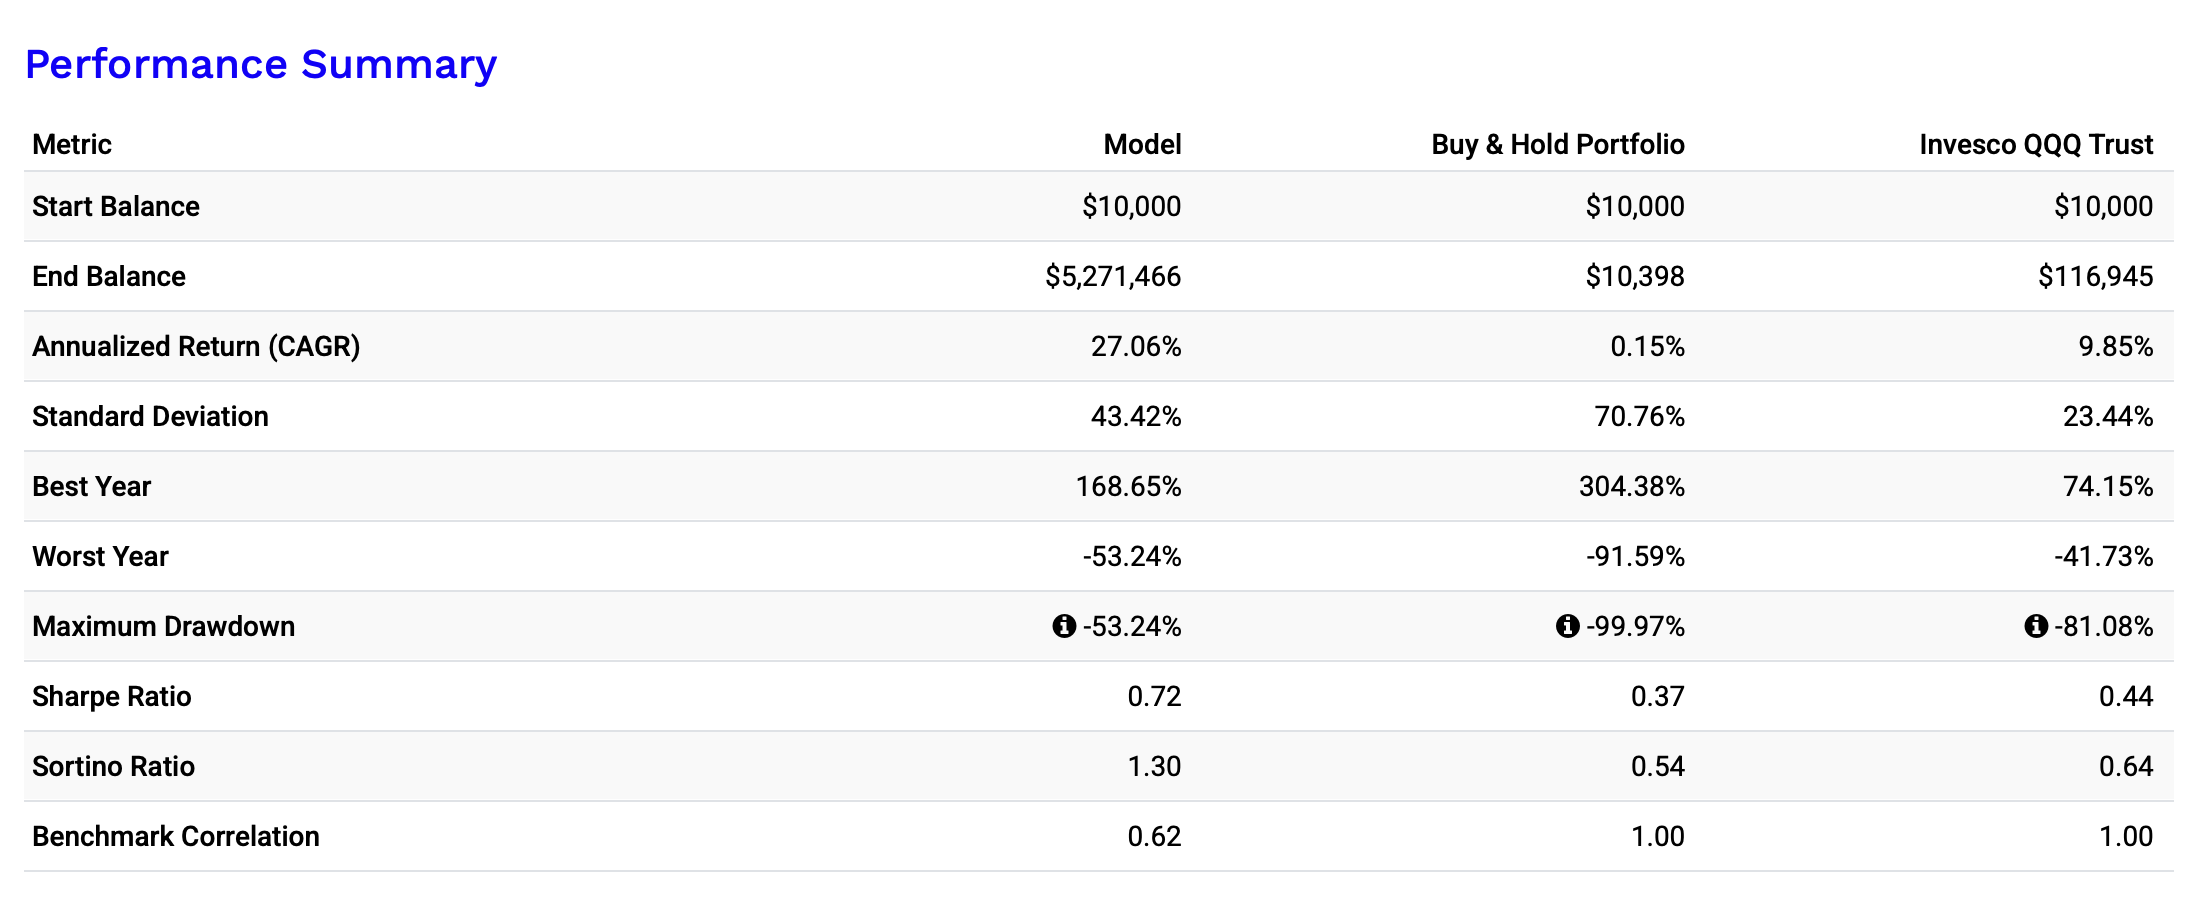
📊 Backtest Results (1999-2025):
💡 Why This Works
Unlike traditional investing, this model avoids catastrophic losses by dynamically shifting between 3x leveraged Nasdaq ETFs (TQQQ/3QQQ) and cash (T-Bills) when the trend weakens. I chose the worst start time in NASDAQ history, just before the dotcom bubble burst. However, the performance is tremendous.
✅ Survived the Dotcom Bubble (-29% vs. -99%)
✅ Handled 2008 better than Buy & Hold (-34% vs. -93%)
✅ Managed 2022 tech sell-off with controlled losses (-46%)
Here you can see the incredible performance:

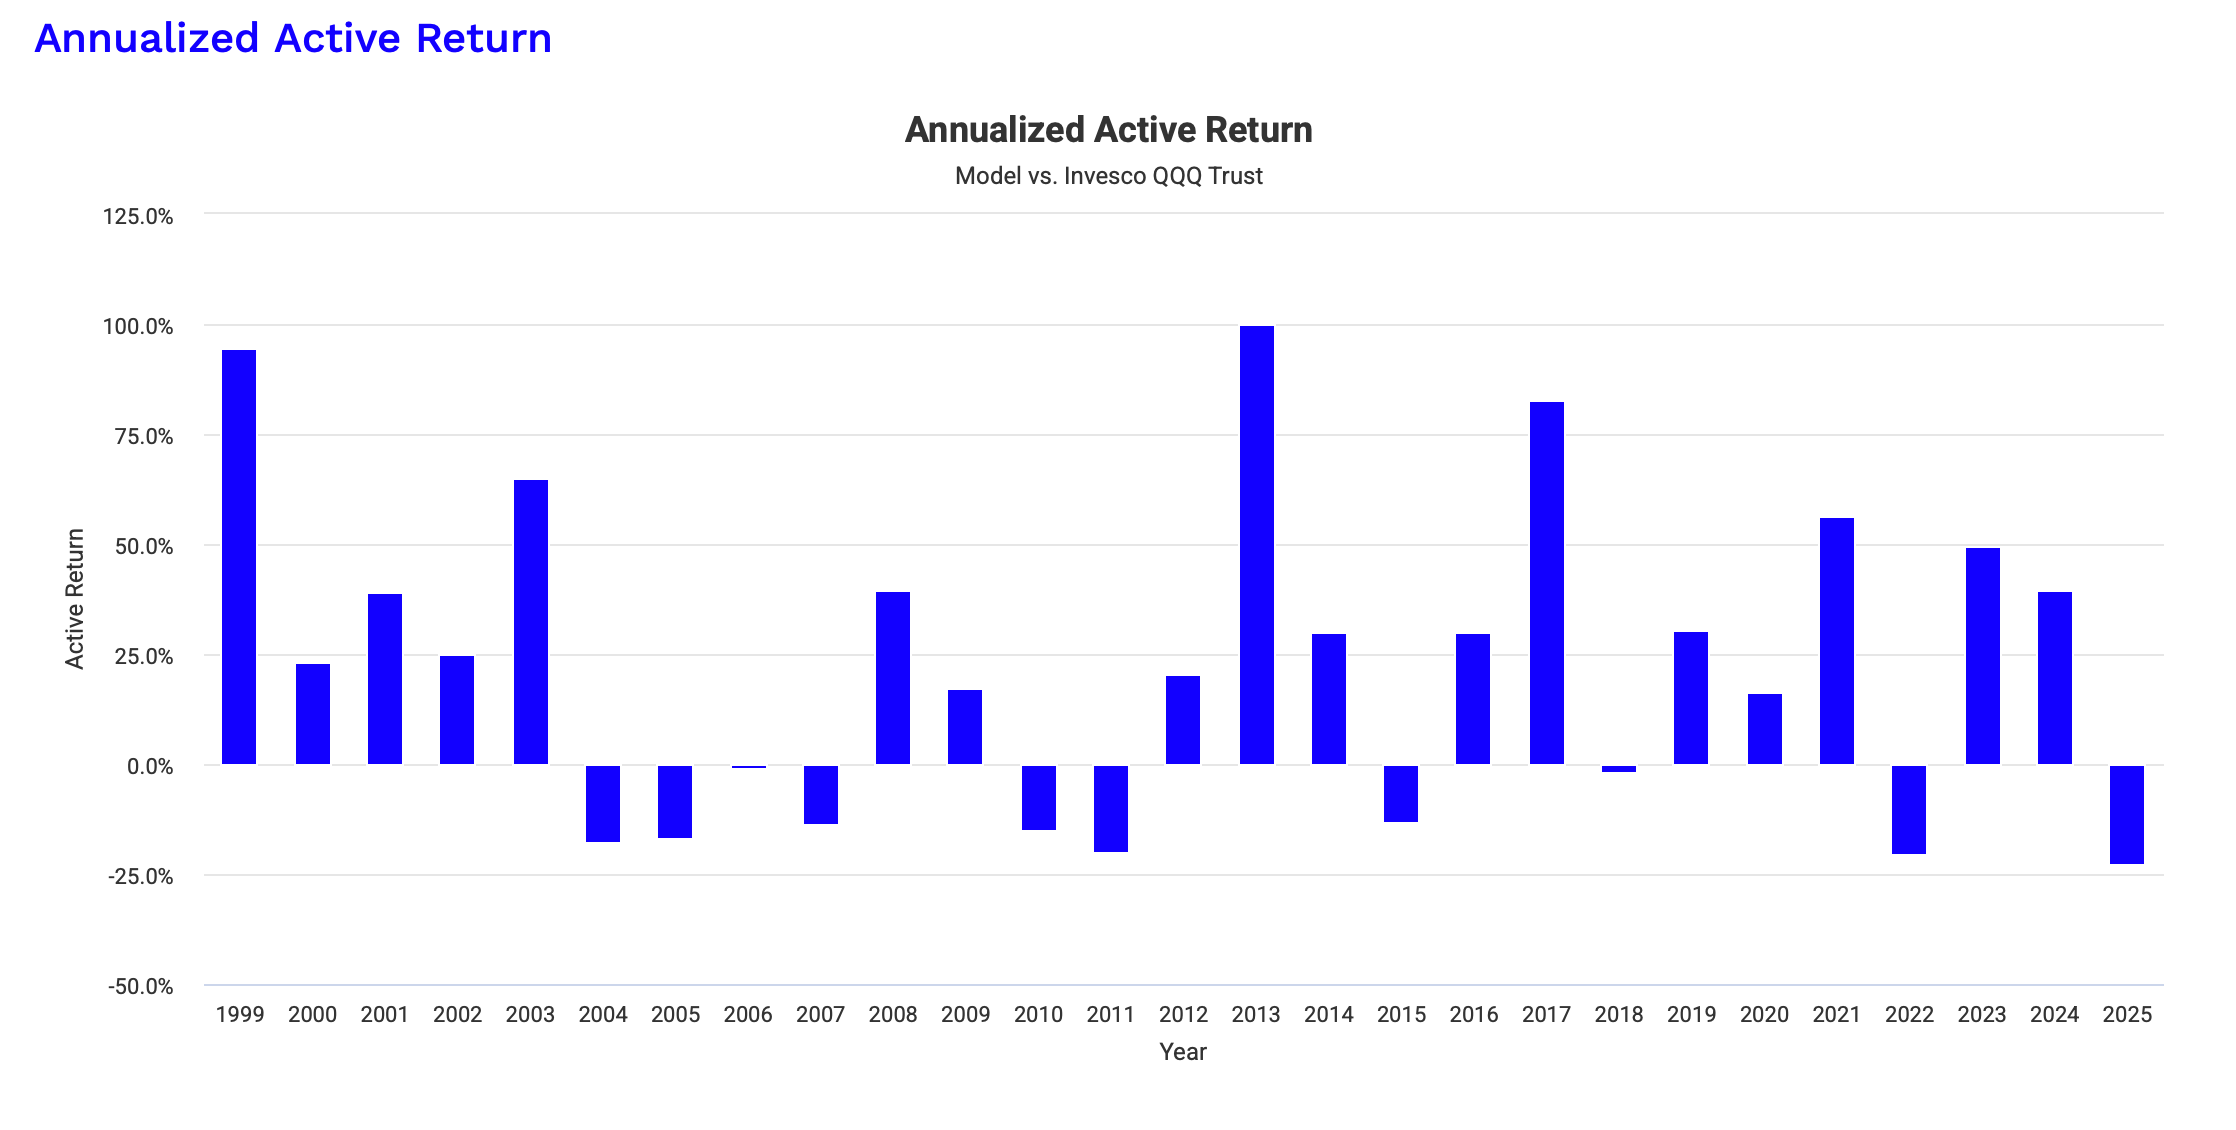
and the annualized outperformance for the last 25 Years compared to the QQQ:
📢 Every week, I share fresh backtesting insights to ensure that this strategy remains one of the most robust in the market.
🚀 Exclusive Content – Only for Premium Subscribers
👉 Upgrade to Premium to unlock my latest market insights, portfolio breakdowns, and trade signals!
🔒 This Week’s Premium Section Includes:
✅ 📊 My Current Portfolio & Allocation – What I’m holding & why
✅ 📉 Market Trends & My Technical Analysis – Where the Nasdaq is heading
✅ 🔍 Next Trade Signals – Key price levels that will trigger action
🔒 Premium Section
Portfolio Breakdown & Market Outlook
Keep reading with a 7-day free trial
Subscribe to The Nasdaq Playbook to keep reading this post and get 7 days of free access to the full post archives.