


Weekly NASDAQ Model Update: +27% Annual Returns Since 1999 – Here’s What the Model Says Now
Our Tactical NASDAQ Model turned $10K into over $6 million with 27% annual returns since 1999 — crushing the NASDAQ. This week’s update reveals the model’s current position, market signals, and more.

📅 Date: 19.07.2025
🧠 Nasdaq-100 Weekly Recap
The Nasdaq-100 rose +0.8% this week, extending its winning streak to five weeks. Momentum slowed near record highs as traders turned cautious ahead of key earnings. Mega-cap tech names like NVDA and MSFT remained strong, while market breadth narrowed. Volatility stayed low, but with slight upticks late in the week. The index remains well above its 200-day moving average, with bullish structure intact. All eyes now turn to upcoming earnings for the next directional move.
📊 Still Think This Is Just Hype?
You’re thinking this sounds too good to be true? That it’s just another flashy system built on backfitting and big talk?
Perfect. We built it for skeptics.
Check the full independent backtest — from 1999 to today.
Same 27%+ CAGR. Lower drawdowns. Better consistency. Across every market regime.
👉 Download it. Stress it. Break it. Then decide.
We’ll be here — still systematic.
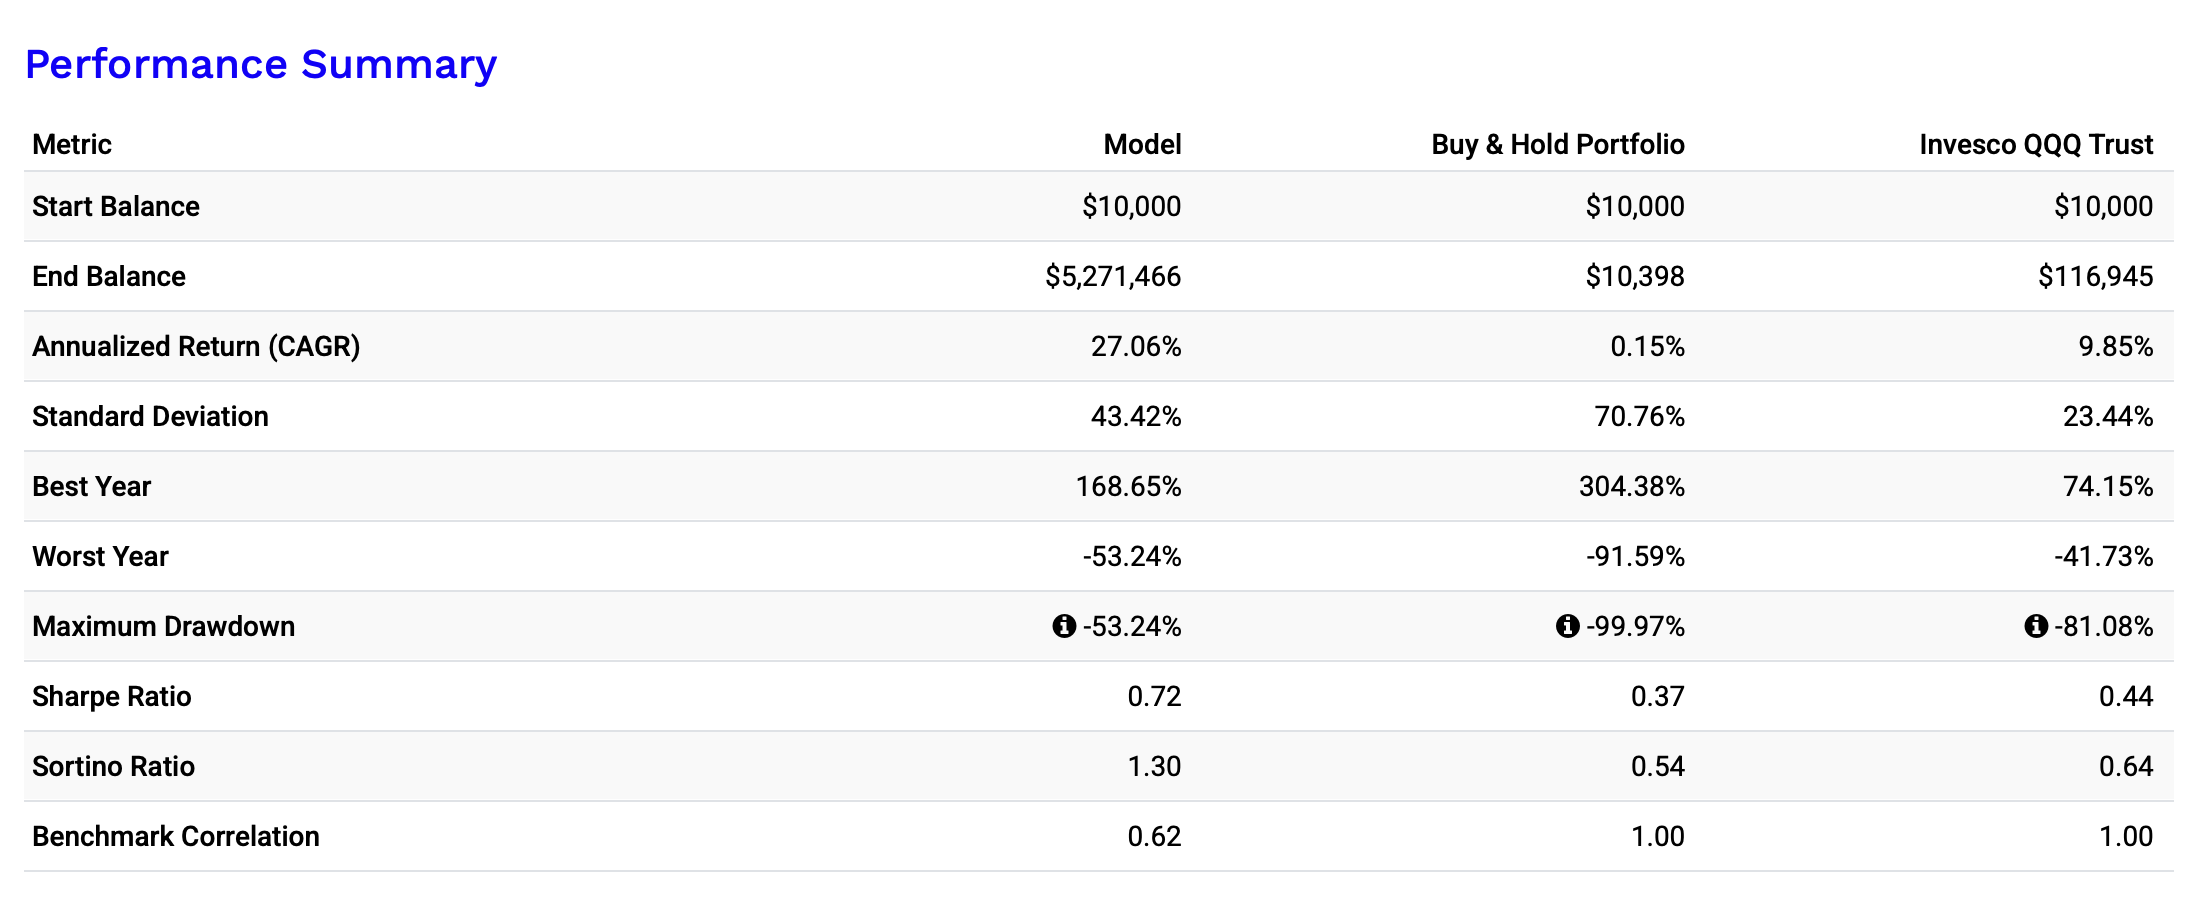
📊 Backtest Results (1999-2025):
💡 Why This Works
Unlike traditional investing, this model avoids catastrophic losses by dynamically shifting between 3x leveraged Nasdaq ETFs (TQQQ/3QQQ) and cash (T-Bills) when the trend weakens. I chose the worst start time in NASDAQ history, just before the dotcom bubble burst. However, the performance is tremendous.
✅ Survived the Dotcom Bubble (-29% vs. -99%)
✅ Handled 2008 better than Buy & Hold (-34% vs. -93%)
✅ Managed 2022 tech sell-off with controlled losses (-46%)
Here you can see the incredible performance:

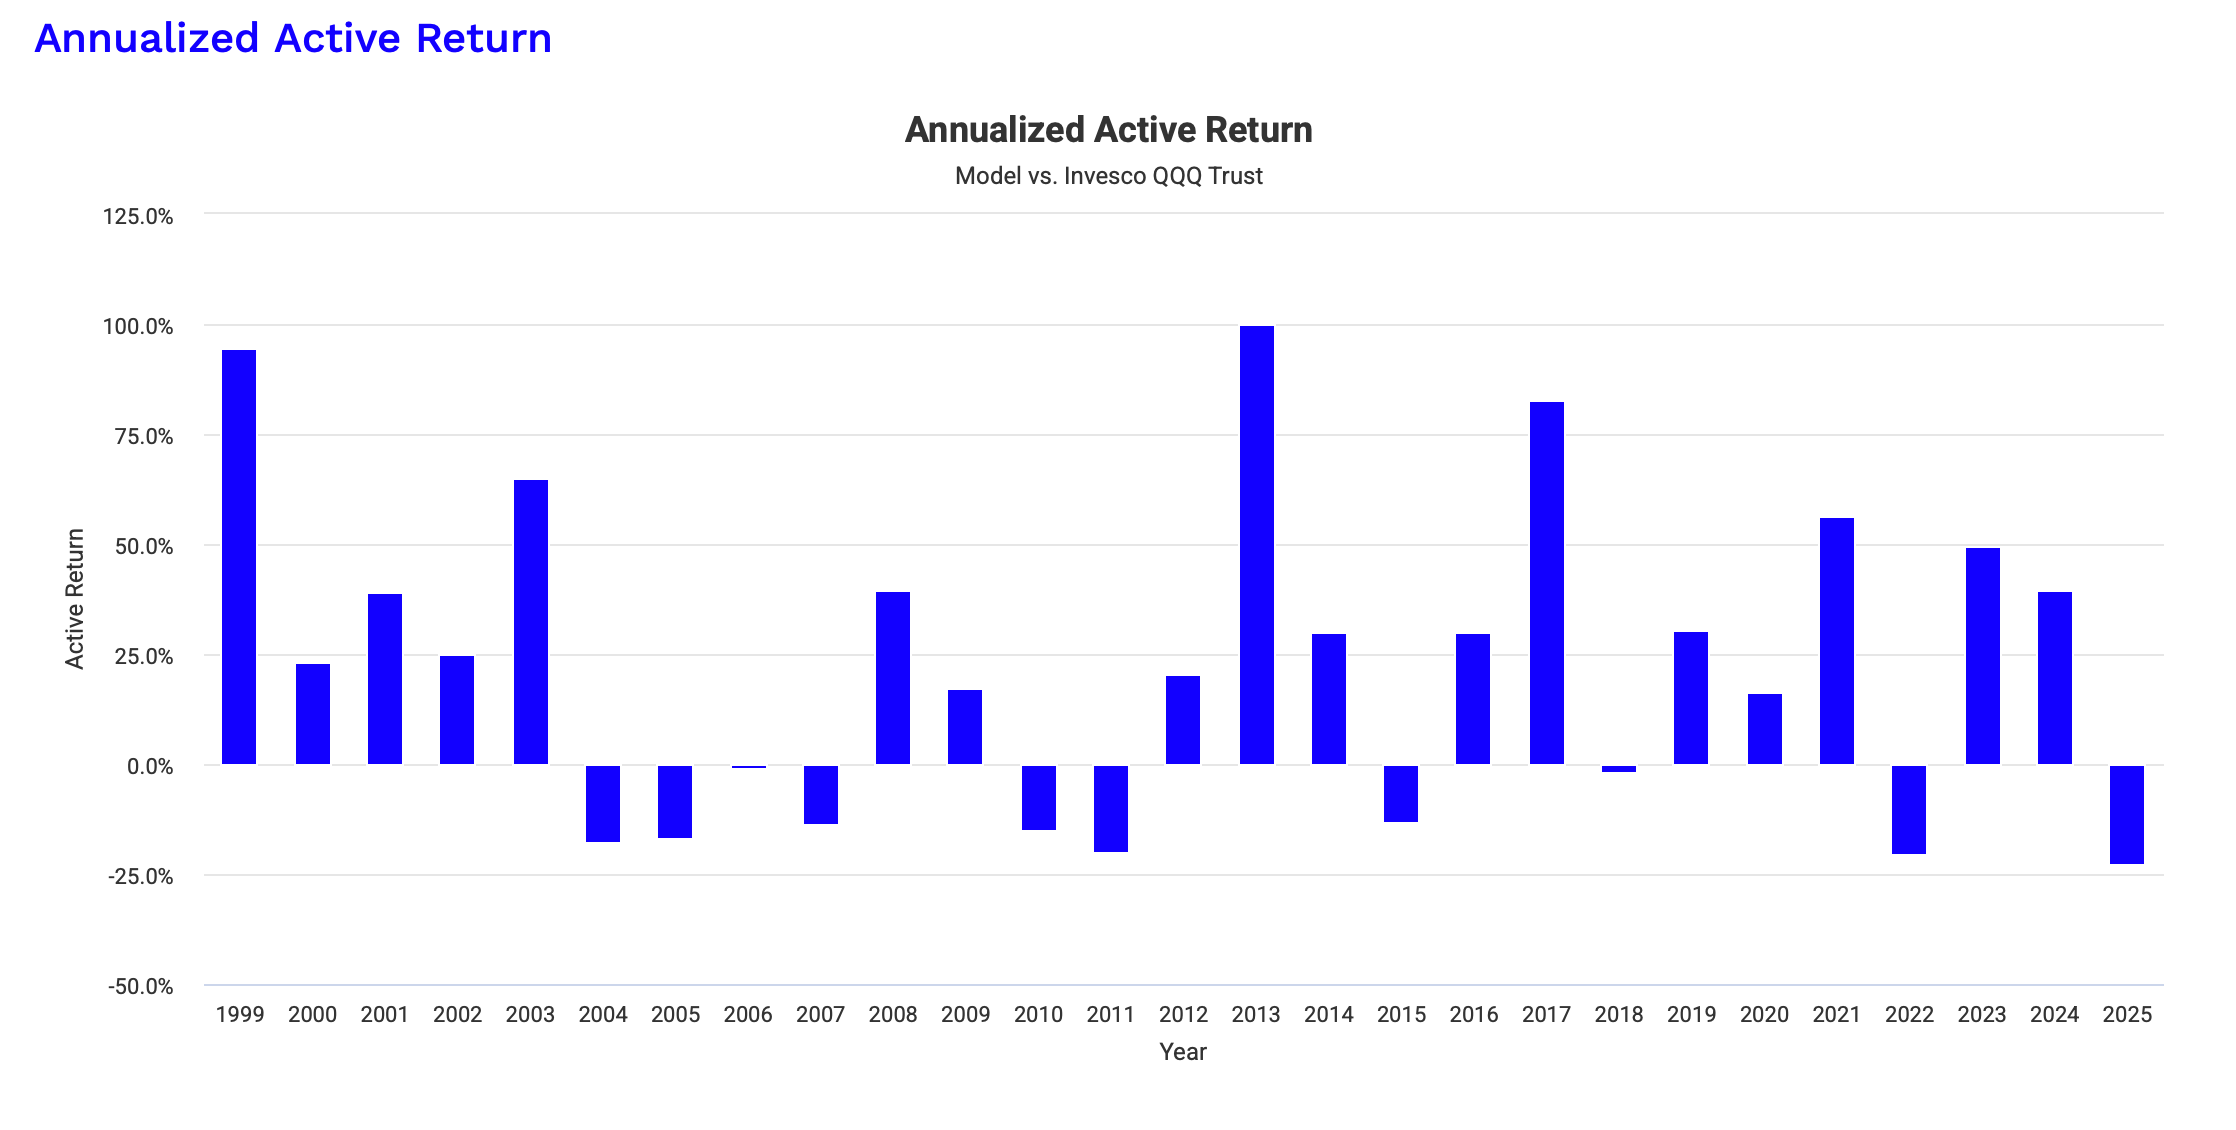
and the annualized outperformance for the last 25 Years compared to the QQQ:
🔍 The Market Moved. But What Did the Model Do?
The headlines show price action — but our model sees what lies beneath:
🔐 Which system activated — and the reason behind it
📊 How the portfolio shifted in real-time
🧠 What silent forces are building beneath the surface
📈 Detailed trade log, system-level breakdowns, and exact allocation logic
This is where the signal starts — and speculation stops.
👉 Step inside the model’s decision engine.
🎯 Follow structure. Ignore the noise.
🔑 Paid Subscribers Only
💼 Current Portfolio Allocation (as of July 12, 2025)
Here’s how the system modules are currently positioned:
Keep reading with a 7-day free trial
Subscribe to The Nasdaq Playbook to keep reading this post and get 7 days of free access to the full post archives.