


VXN <18: The Line Between Chaos and Clarity
The 18 VXN Rule: A Quiet Filter with Massive Performance Impact.

Welcome to The Nasdaq Playbook – Tactical Classroom, where we take you deep into the engine of our model. Today’s focus: volatility — and specifically, why our system goes to cash when volatility exceeds a certain threshold.
If you’ve ever wondered why we’re not jumping back into the 3x leveraged Nasdaq just yet — this post explains it.
🌪️ Volatility: The Hidden Threat Behind Market Rallies
Not all green candles are created equal.
You’ve probably seen it: the market rallies sharply after a correction, sentiment flips bullish — but our model doesn’t re-enter. Why?
Because volatility is a silent killer. It erodes leveraged returns, invalidates trend structure, and injects noise into otherwise readable charts.
📉 Enter the VXN
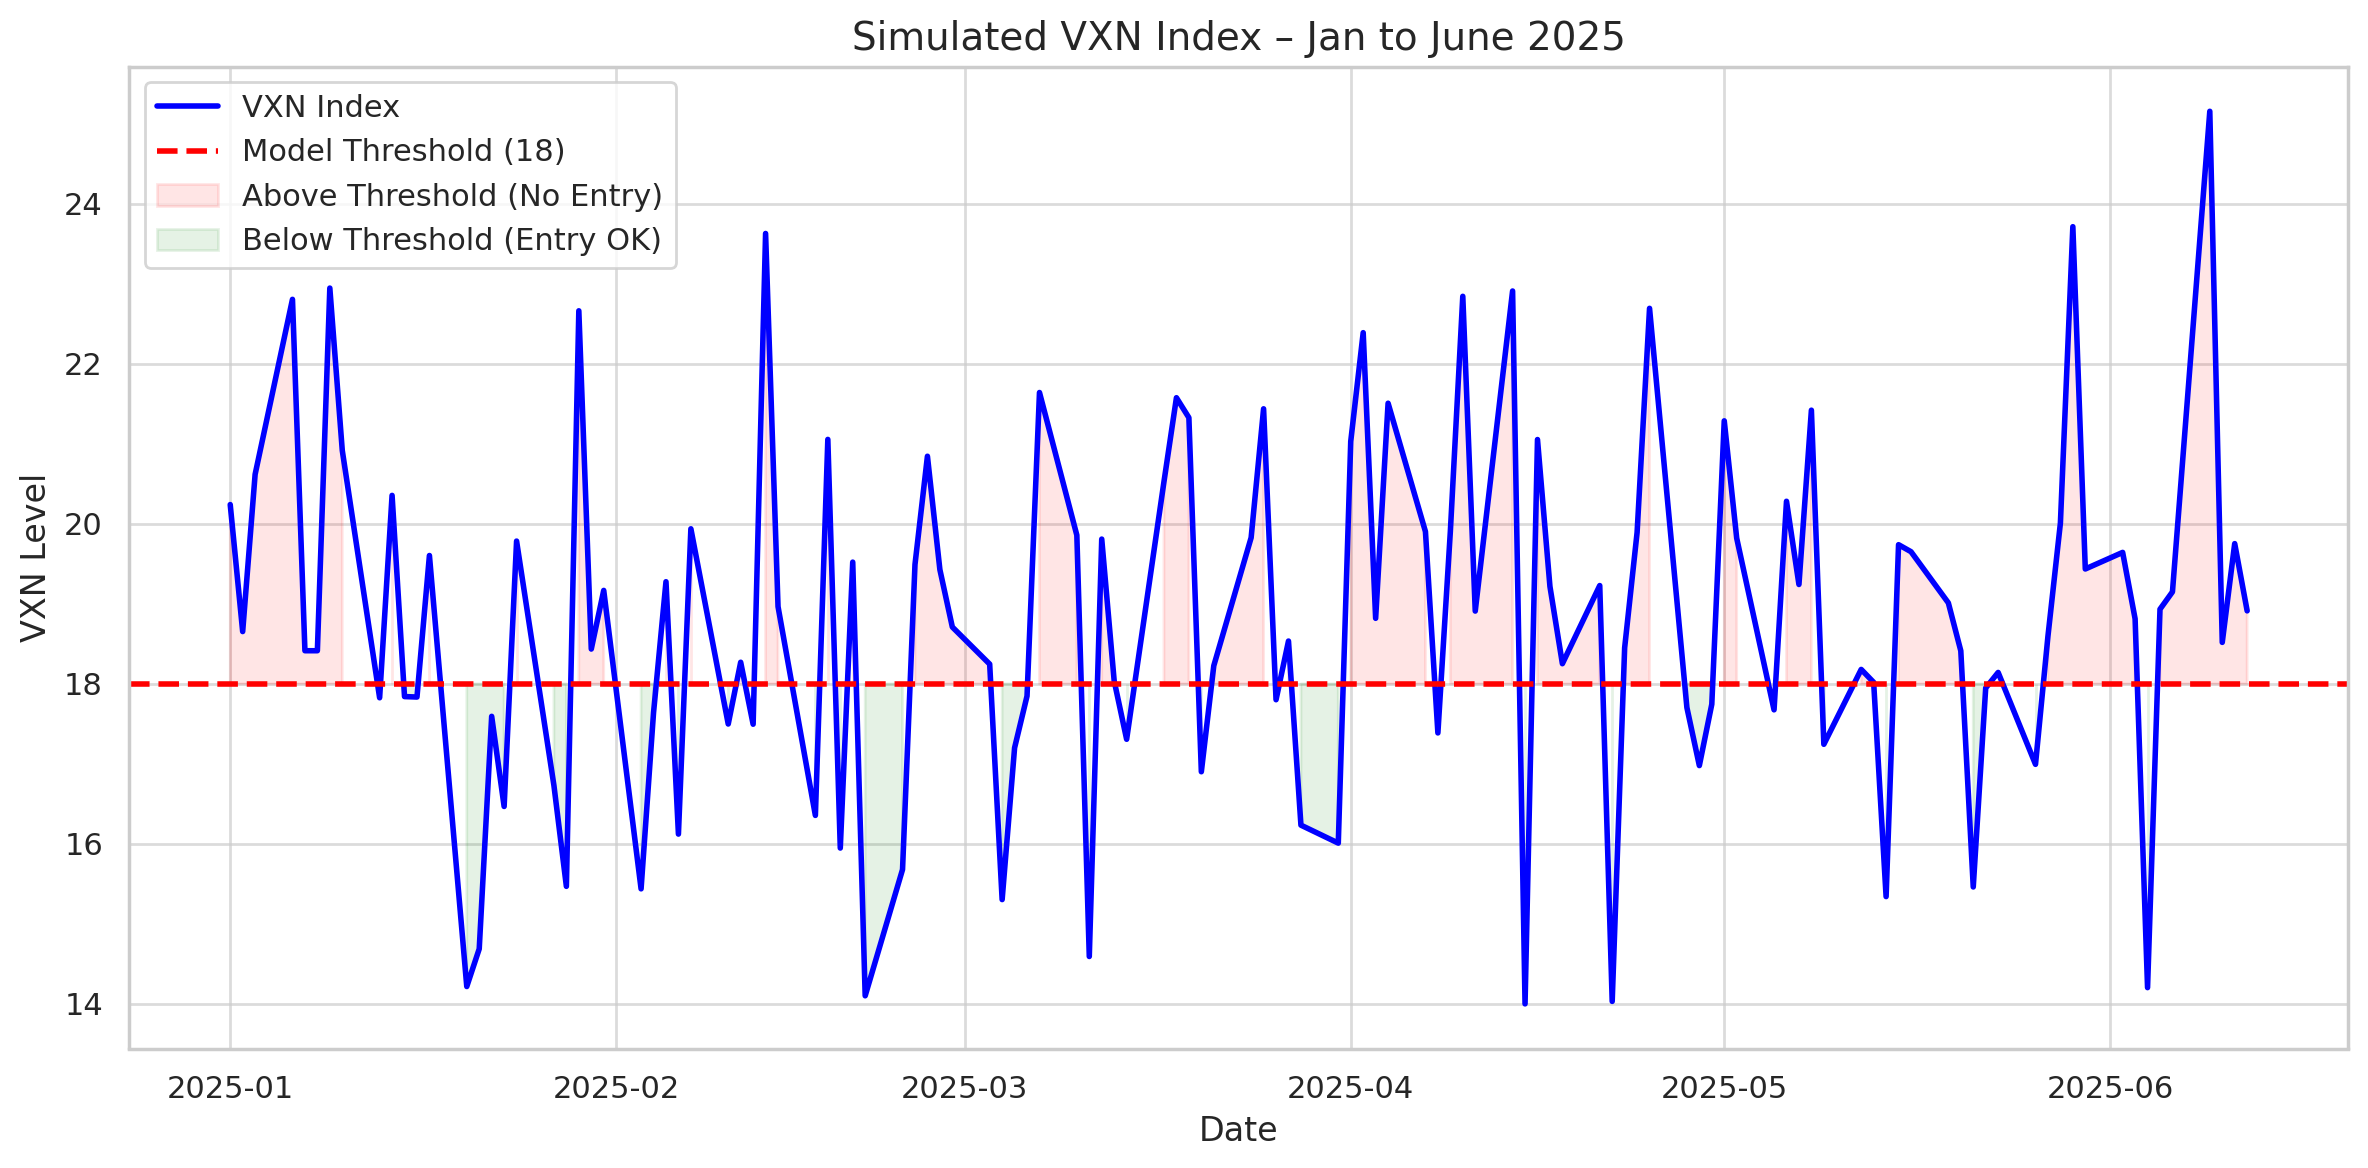
Our model uses the VXN — the Nasdaq-100 Volatility Index — as a proxy for market stress. When VXN is above 18, the model refuses to re-enter, no matter how promising the price action looks.
Why 18?
Because the historical data is clear:
📊 Backtest Insight: VXN and Signal Quality
We backtested over two decades of signals and found this:
When VXN < 18:
→ Model win rate = 68%
→ Average trade return = +37.4%When VXN ≥ 18:
→ Model win rate = 42%
→ Average trade return = +5.1%
That’s not a small difference — it’s the difference between compounding wealth and barely surviving.
In leveraged systems, volatility doesn’t just create uncertainty — it creates decay. Products like TQQQ suffer when volatility rises, even if the index ends flat.
🔬 Academic Support: Volatility Clustering
This isn't just a backtest anomaly. Academic research backs this up:
"Periods of elevated implied volatility tend to cluster and predict negative excess returns, especially in highly volatile, growth-heavy indices."
— Bollerslev et al. (2009), Volatility Risk Premia and Stock Return Predictability
Translation? When implied volatility (like VXN) spikes, future returns deteriorate, especially in high-beta sectors like tech.
That’s why our model goes flat.
We’re not fearful — we’re statistically informed.
🔍 Real-World Example: 2022 Fakeouts
Let’s rewind to 2022.
In March, July and November, the Nasdaq staged sharp rallies. But VXN was consistently above 25. Our model stayed in cash.
Each time, the rally failed — and the Nasdaq made lower lows.
The system didn't fall for it. And that saved us over -40% in unrealized losses.
🔒 Premium Section – Allocation Update & Volatility Status
Keep reading with a 7-day free trial
Subscribe to The Nasdaq Playbook to keep reading this post and get 7 days of free access to the full post archives.